
After years of relatively stable exchange rates among major currencies, this year’s dramatic currency market fluctuations have complicated the task of managing international assignee compensation packages. The expanding array of temporary compensation arrangements and types of pay …
… delivery has added to the challenge.
This spot survey was designed to provide a snapshot of the prevalence of different types of currency protection schemes, as well as to capture some perceptions about their effectiveness.
One hundred eighty global organizations representing over thirty industry sectors completed the survey within a few days of its launch. Clearly this topic hit a nerve, and the robust survey results provide some helpful guidance for companies seeking to develop or enhance currency protection schemes. In brief, respondent companies with well-defined currency protection plans and regular update schedules were most likely to report that they are managing the impact of currency change effectively.
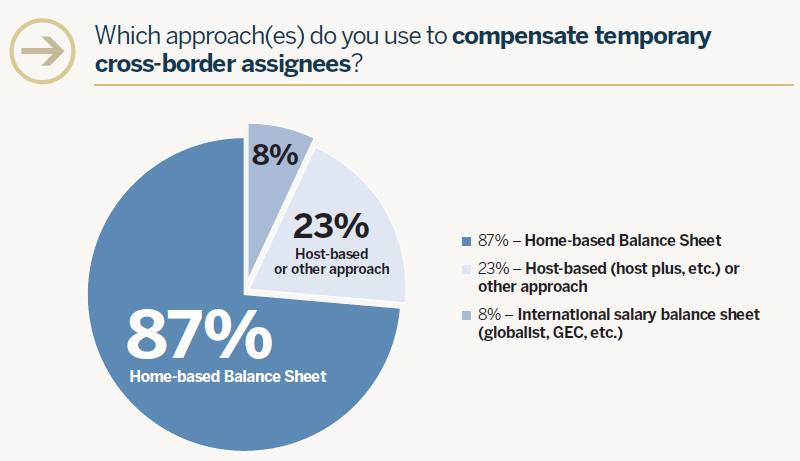
In an attempt to show best practices for different approaches to international assignment compensation, respondents were asked to characterize their current programs. The highest proportion of responses confirmed the use of the traditional balance sheet, which offers built-in flexibility for currency protection.
Of respondents not using some form of the balance sheet, the great majority indicated that they use some type of host-based approach. Confirming the trend toward a more complex set of compensation offerings, however, some of the “other” responses mentioned variations on home- or host-based approaches (“home based, but no balance sheet”, “host pay, protection of home savings”) or a choice of approaches (“home and host depending on market and volatility”).
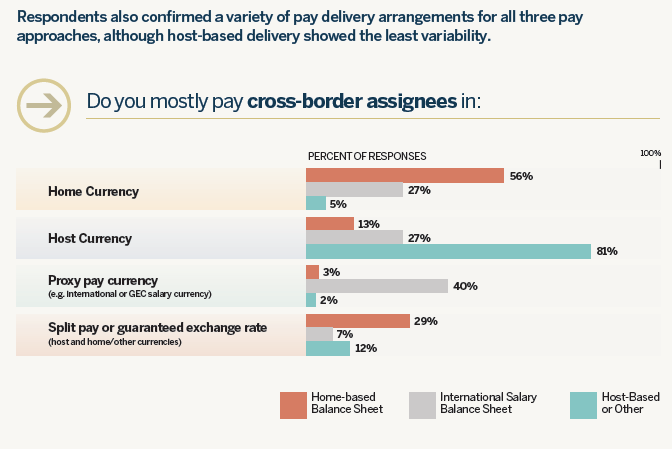
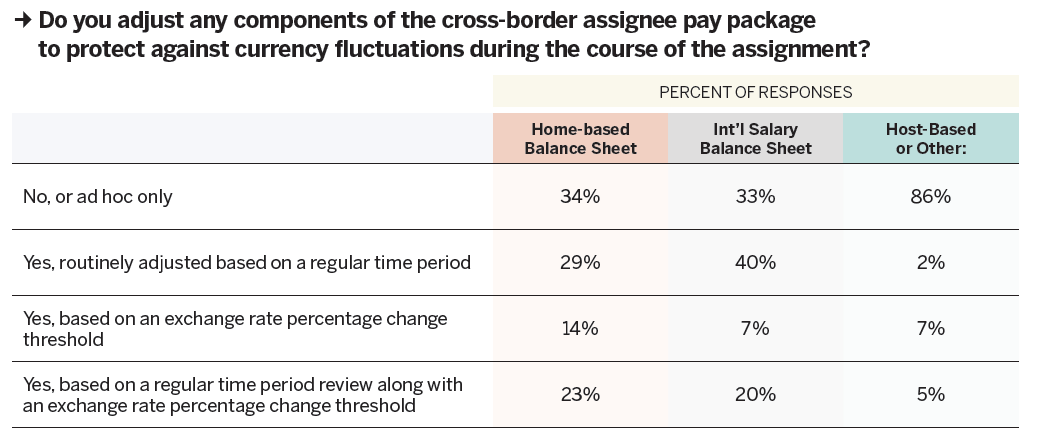
Most balance sheet respondents confirmed that they do have formal currency protection in place, though a high proportion either take no action or respond ad hoc. The vast majority of those using host-based approaches do not have any formal currency protections in place.
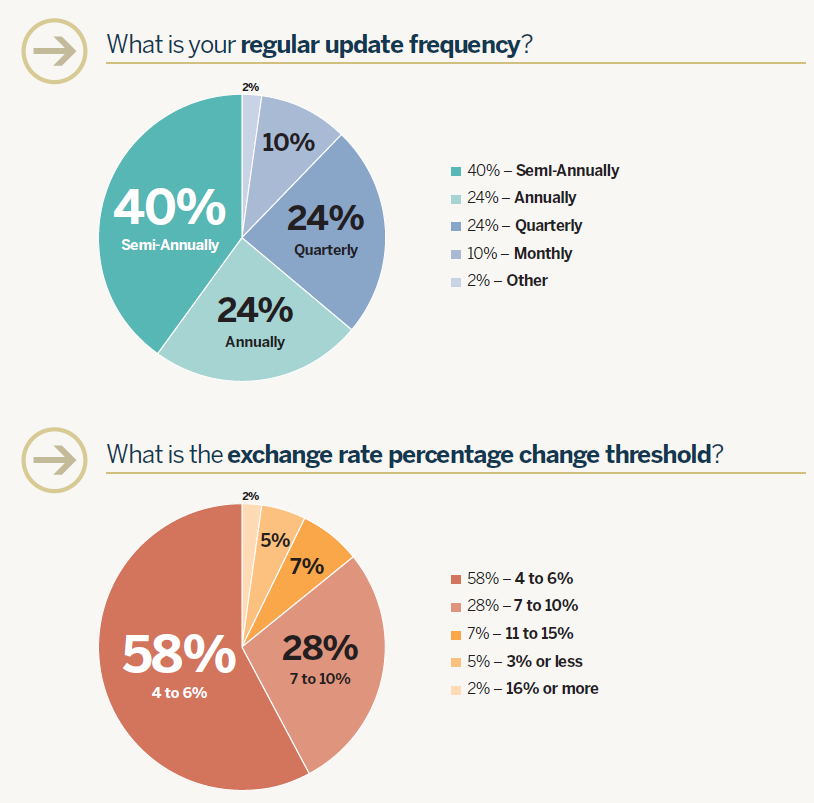
For those who do use formal currency protections, there is much variation in regular update schedules, with the most common frequency being semi-annual. However, more frequent updates (monthly or quarterly) comprise over a third of total responses. For exchange rate change thresholds, the 4-6% range was most frequently reported, followed by the 7-10% range. Given the small number of host-based responses, the following charts aggregate responses for home-based and international salary balance sheet approaches only:

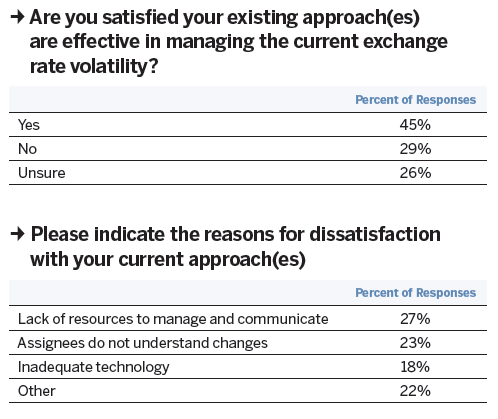
With more than half of all companies either dissatisfied with or unsure about the effectiveness of their current practices, it is evident that many companies have a significant opportunity to enhance program effectiveness and improve assignee satisfaction, particularly around communications
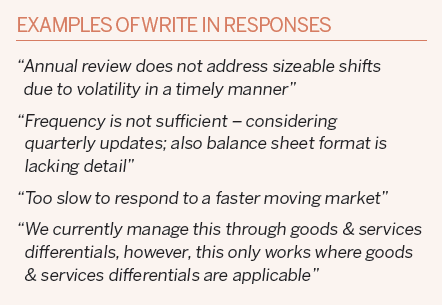
Of the “dissatisfied” group, the most commonly mentioned concerns were related to communications with assignees and inadequate resources, though a number of the write-in “other” responses mentioned too-infrequent updates or the lack of currency protection schemes for host-based pay assignees.
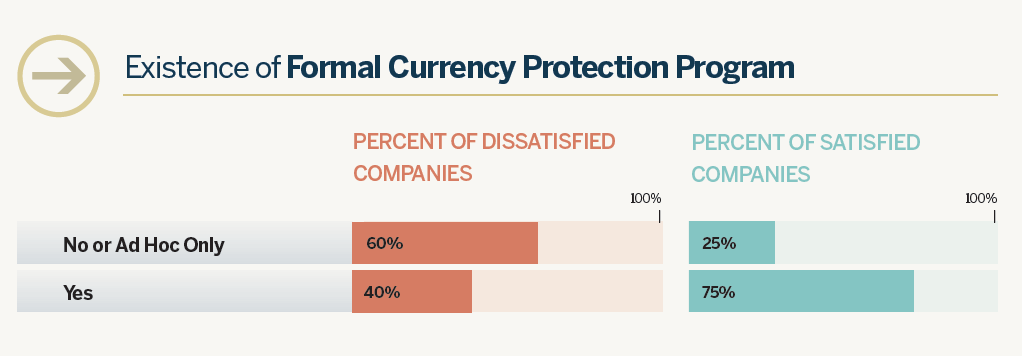
It’s interesting to note that companies reporting dissatisfaction also have a low prevalence of formal currency protection programs – only 40% of the dissatisfied group. In contrast, 75% of the companies reporting satisfaction have formal currency protection programs.
Conclusion
Given the results of this survey, it is not surprising to find that a full third (33%) of respondents are considering changing their current approaches to managing currency volatility. A further 42% are unsure, with the remaining 25% planning to continue with their existing approaches.
The survey results do confirm that the impact of currency fluctuation is best managed with a combination of practices:
- Carefully designed programs that align with compensation approaches and pay delivery
- Regular reviews and updates
- Clear communications to assignees
Participating Companies Profile
One hundred eighty firms responded to our spot survey on currency volatility. 48% of them are headquartered in the Americas, 41% in Europe, the Middle East, and Africa (with most in Western Europe and the U.K.), and 11% in Asia-Pacific.
Overall, more than thirty major industry sectors are represented. Over forty percent of the respondents indicated that they primarily represent the consumer goods, financial services, manufacturing, and telecommunications/technology sectors. Other well-represented sectors included pharmaceuticals/health care/biotech, oil and gas, engineering and construction.

 Seite drucken